Expert Advice with Jeremy Sheppard
Introduction
Let’s say you do some research for a certain suburb and you discover that 80% of properties in the suburb are houses. A lot of investors, even some professionals, will tell you, “The demand in this market is obviously for houses, so why would you buy a unit?”
The thing is, that data, “80% houses”, doesn’t help with your choice of property type.
Supply & Demand
First of all, you need to remember that supply & demand dictate price growth.
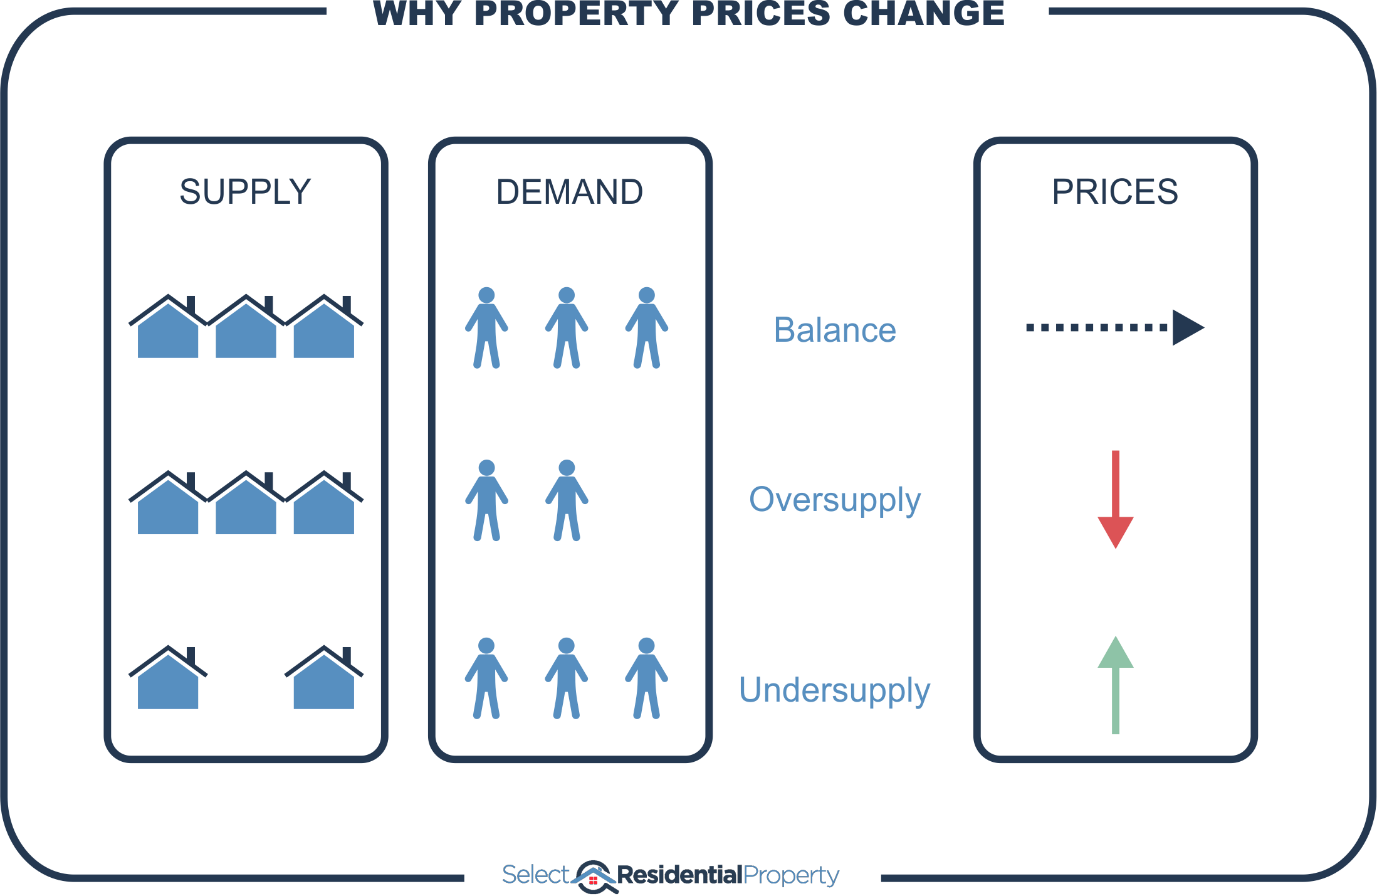
If supply and demand for property are in balance, prices don’t change. If supply outweighs demand, then prices should fall. If demand exceeds supply, prices should rise.
What does “80% houses” tell you?
The experts will confidently claim it’s telling you about demand. They’ll say the majority of buyers are demanding houses. But that’s not necessarily true.
If 80% of the properties built in the suburb to date have been houses, does that really represent demand? 80% of the properties built in that suburb were houses. 80% of dwellings developed in that suburb were houses. 80% of properties supplied to that suburb were houses.
What gets built is supply, not demand and ...
“Supply is the enemy of capital growth”
Don’t interpret supply as demand or you’ll end up in a world of hurt.
Now there’s a very good chance that before deciding to build anything, developers did some research to guess what would be in demand. And for relatively new properties, that might still hold true today. But what if the houses were built 10, 20 or 30 years ago? What if the demographics have changed?
“Demand for a certain type of property can’t be determined by the proportion of that property type in a suburb”
The proportion of houses to units reflects what has been supplied, not what is in demand.
What if there are empty houses?
Imagine a suburb with 100 properties and 80 of them are houses and 20 of them are units. And imagine that 8 of those 80 houses are currently vacant while the remaining 72 are occupied. Let’s also assume that all of the 20 units are occupied.
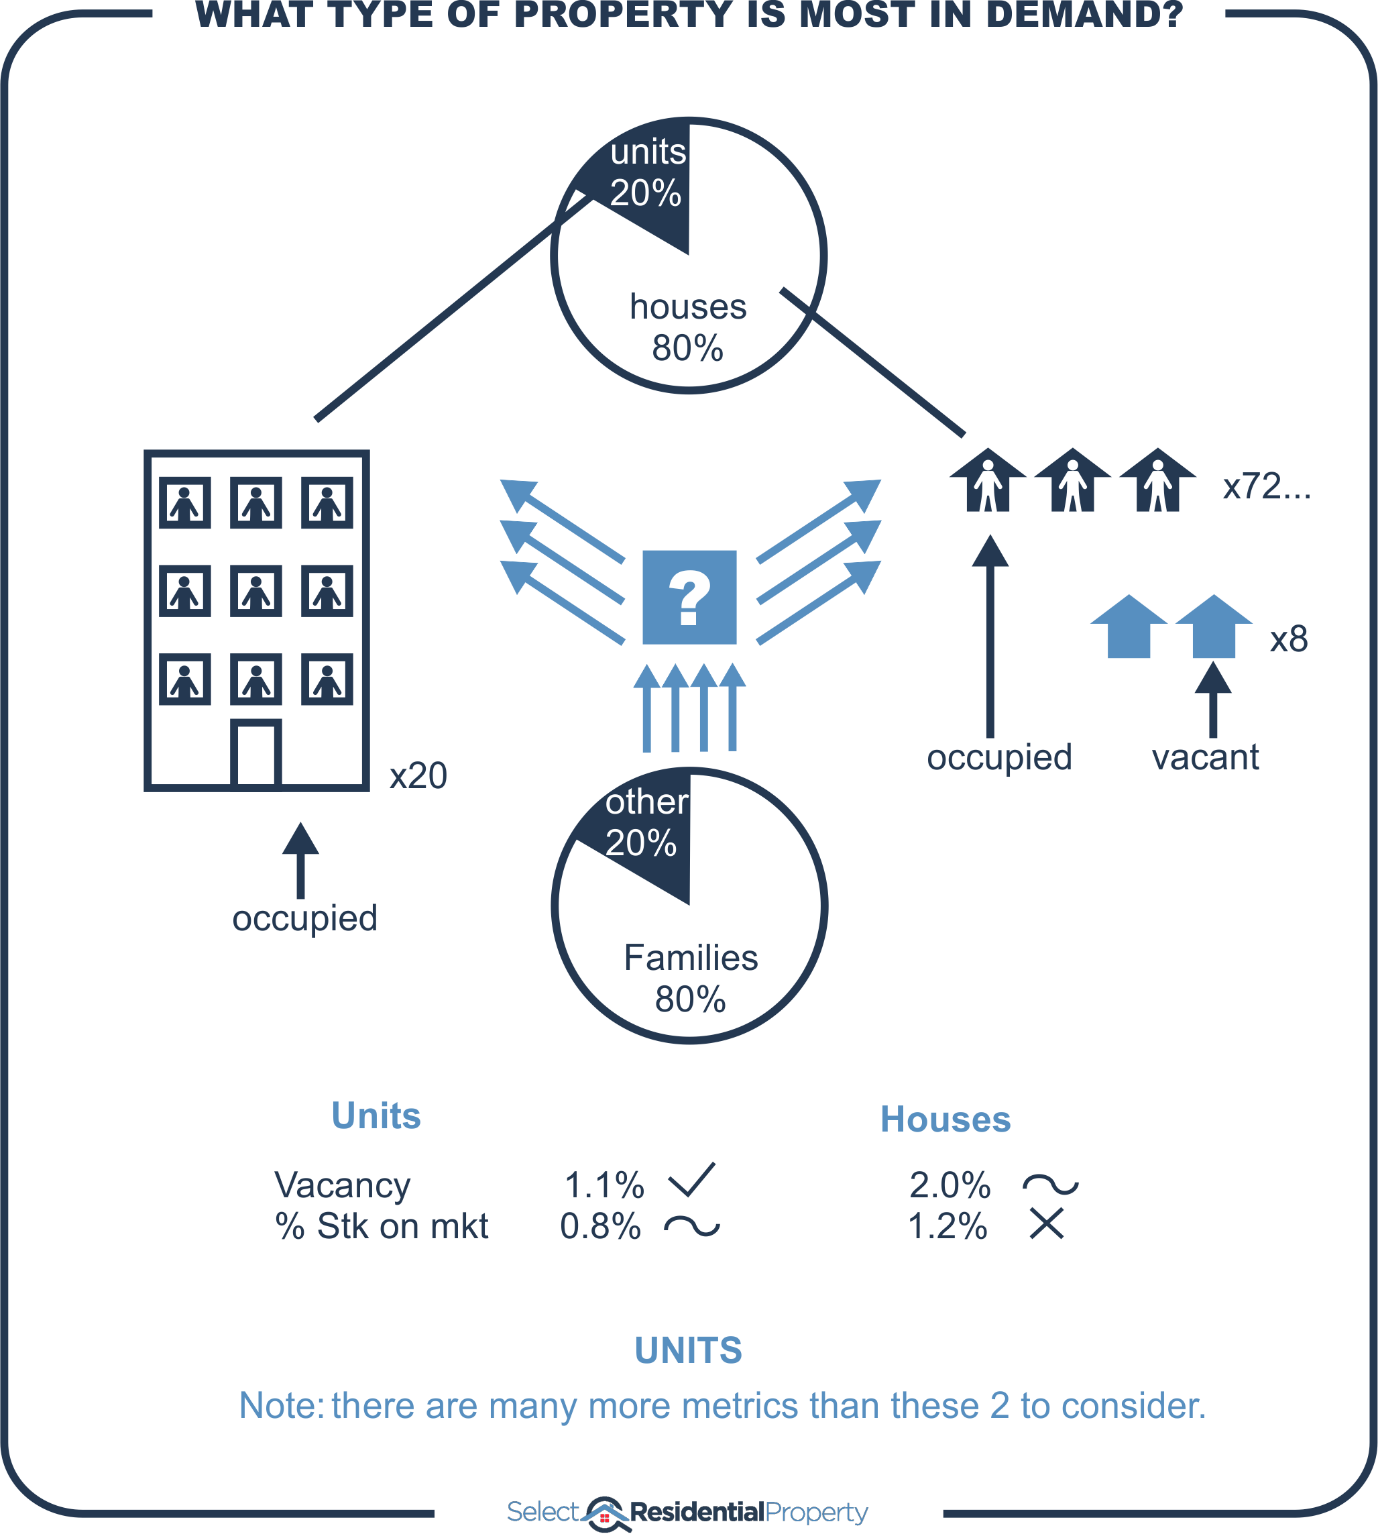
If 8 of the 80 houses are vacant and for sale, then there’s an oversupply of houses. But if none of the units are vacant or for sale, then demand exceeds supply for units.
What we really need to know is what properties are in demand but not supplied.
Families
Let’s assume we did a little more demographic research on this suburb and we found out that 80% of the residents are families with 2.3 kids. That suggests it’s a family-oriented suburb. Surely families prefer houses to units, especially families with 2.3 kids.
That’s not a bad guess. But keep in mind that if the remaining 20% of residents that aren’t families occupy the remaining 20% of properties, which are units, then the demand for units looks just as strong as the demand for houses – it’s still one-for-one.
So again, this demographic data served little purpose because it hasn’t told us about supply & demand.
80% Families 40% Houses
What if 80% of the residents are families with 2.3 kids, but only 40% of the dwellings are houses. That sounds like families are forced into units when they might prefer a house but there aren’t enough houses. Now do we have a case of demand exceeding supply?
It's not a bad guess, but what if units are all those families could afford? “Wanting” to live in a house isn’t the kind of demand that pushes prices up. When someone places a higher offer or ups the bid at auction, that reflects the kind of demand that pushes prices up.
So, what are we looking for then?
For starters, you could compare the vacancy rate for houses against that for units in the same suburb. And similarly, you could compare the percentage of property currently available for sale for both houses and units.
Not only are these better indicators of supply and demand, they’re current. But the demographic data referred to above, comes from census which is only conducted once every 5 years. And it’s often not published until a year after census night.
Conclusion
The lessons are:
- Don’t blindly swallow what professionals spew out
- Think for yourself and challenge what they say
- Be careful how you interpret property data
- Go a little deeper than a cursory understanding
- And don’t rely on only a handful of metrics, you need a comprehensive view
....................................................................................
 Jeremy Sheppard is head of research at DSRdata.com.au.
DSR data can be found on the YIP Top suburbs page.
Click Here to read more Expert Advice articles by Jeremy Sheppard
Disclaimer: while due care is taken, the viewpoints expressed by contributors do not necessarily reflect the opinions of Your Investment Property.